
Mood Tracking for Clinicians: Evidence-Based Protocol
An evidence-based mood tracking protocol for therapists and prescribers, plus MDQ screening guidance and a free downloadable Mood and Symptom Chart.


A printable mood chart looks simple: a grid, a 1-to-10 scale, a few lines for sleep and medication doses. Handed to a patient without context, though, it is just a sheet of paper that gets filled in for two weeks and then forgotten in a kitchen drawer. Used with a screening step, a clear cadence, and a review routine built into every visit, that same chart becomes one of the more useful low-cost tools in a behavioral health practice.
This guide reviews what the research actually says about mood tracking's clinical value, where it breaks down in real practice, and how to build it into a treatment plan or medication-management workflow without adding to your own documentation burden. You will find a prescription-style protocol you can hand to your next patient, four patient scripts for both therapy and prescribing contexts, and a rundown of when a mood tracker app makes more sense than a paper log. A downloadable Mood and Symptom Chart, described in detail below, is the concrete resource this whole guide is built around.
Mood tracking is a useful measurement and insight tool for behavioral health treatment, but current evidence does not support it as a standalone treatment on its own.
Key takeaways
- Mood tracking is most useful as a measurement and insight tool, not a standalone treatment. Recent evidence does not show meaningful symptom improvement from mood monitoring alone, but tracking can help clinicians identify patterns in mood, sleep, triggers, and medication response.
- Keep tracking simple enough for patients to sustain. Across 77 mood-monitoring studies, average adherence was 64% and attrition was 28%, reinforcing the value of limiting the number of fields and reviewing the chart early and consistently.
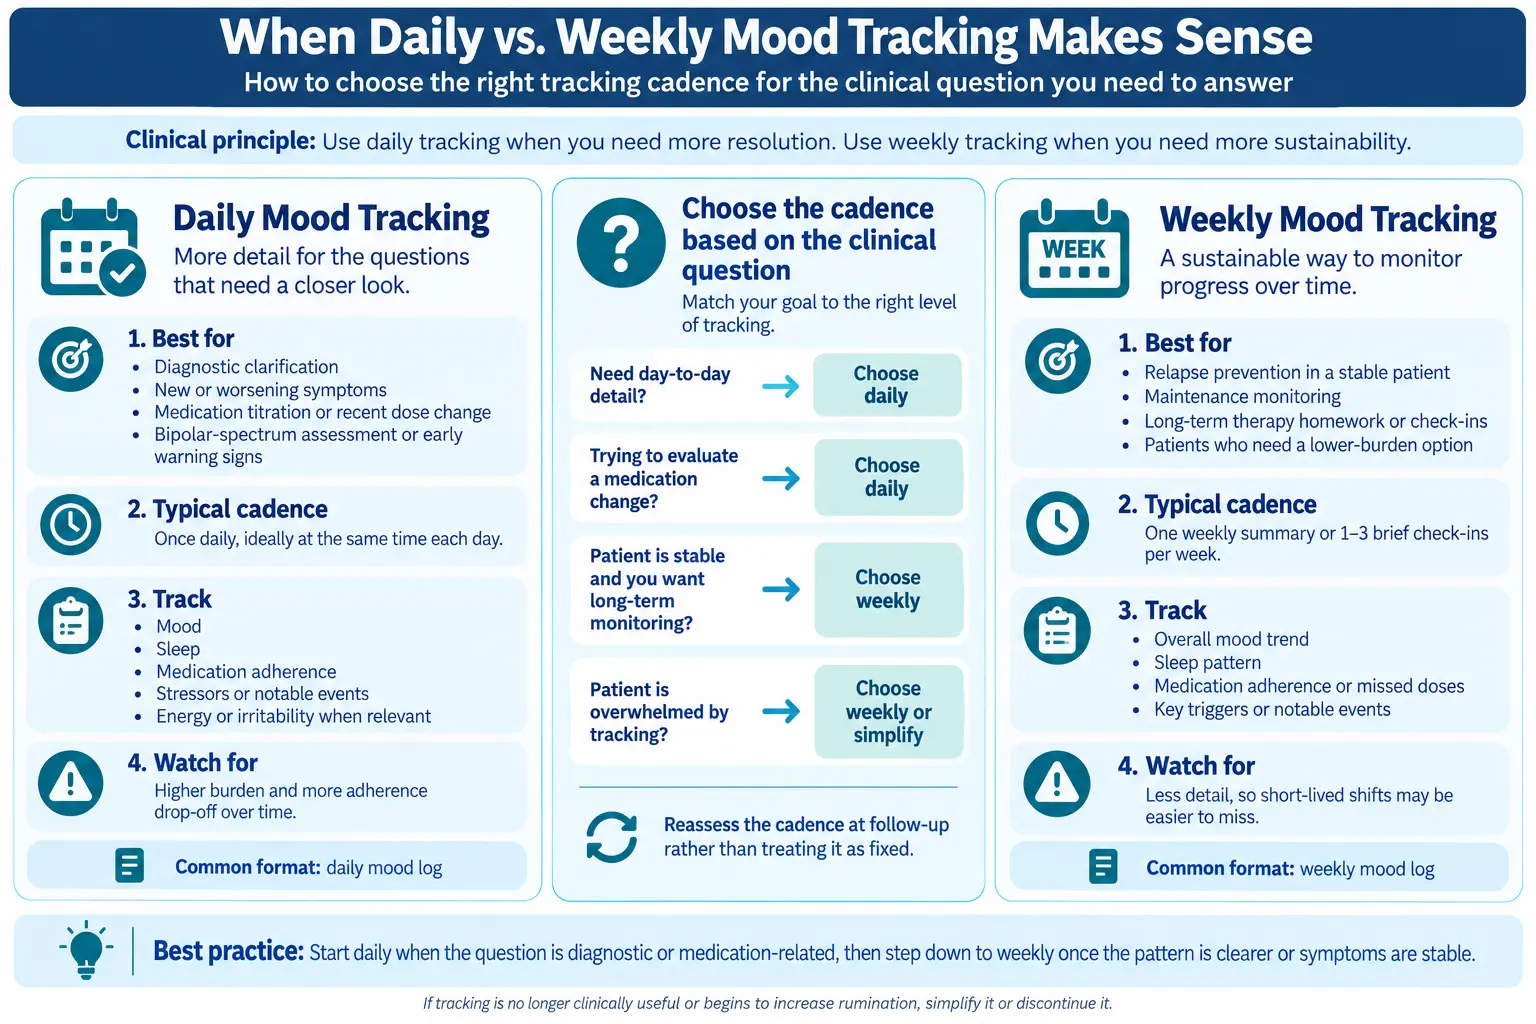
- Use daily tracking when you need detail, then reduce the burden once the clinical question is clearer. Daily logs are most useful for diagnostic clarification, medication titration, and emerging symptoms; weekly tracking often makes more sense for maintenance and relapse prevention.
- The Mood Disorder Questionnaire can help determine when prospective mood tracking is warranted. The MDQ is a bipolar-spectrum screening tool, not a diagnostic instrument, and its sensitivity is lower in patients without a previous bipolar diagnosis.
- Review the data with the patient and use it to make decisions. A mood log is most clinically useful when it changes what you assess, discuss, monitor, or adjust at follow-up.
What the Evidence Actually Shows About Mood Tracking
Measurement-based care, the practice of using patient-reported data to guide treatment decisions, has one of the stronger evidence bases in behavioral health. A widely cited review in Psychiatric Services describes measurement-based care as the systematic evaluation of symptoms before or during a visit to inform what happens next in treatment (Lewis et al., 2018). Mood tracking is a specific, patient-driven form of that same practice, and it inherits both the promise and the caveats of the broader measurement-based care literature.
The strongest, longest-standing example is the NIMH Life Chart Method, developed for prospective bipolar mood monitoring. A review in the Journal of Affective Disorders describes it as "an important clinical tool for monitoring the bipolar mood course," useful to both clinician and patient for understanding how mood, sleep, and life events interact over months rather than single visits. That longitudinal view is the actual clinical case for tracking: a single visit gives you a snapshot, a chart gives you a trend line.
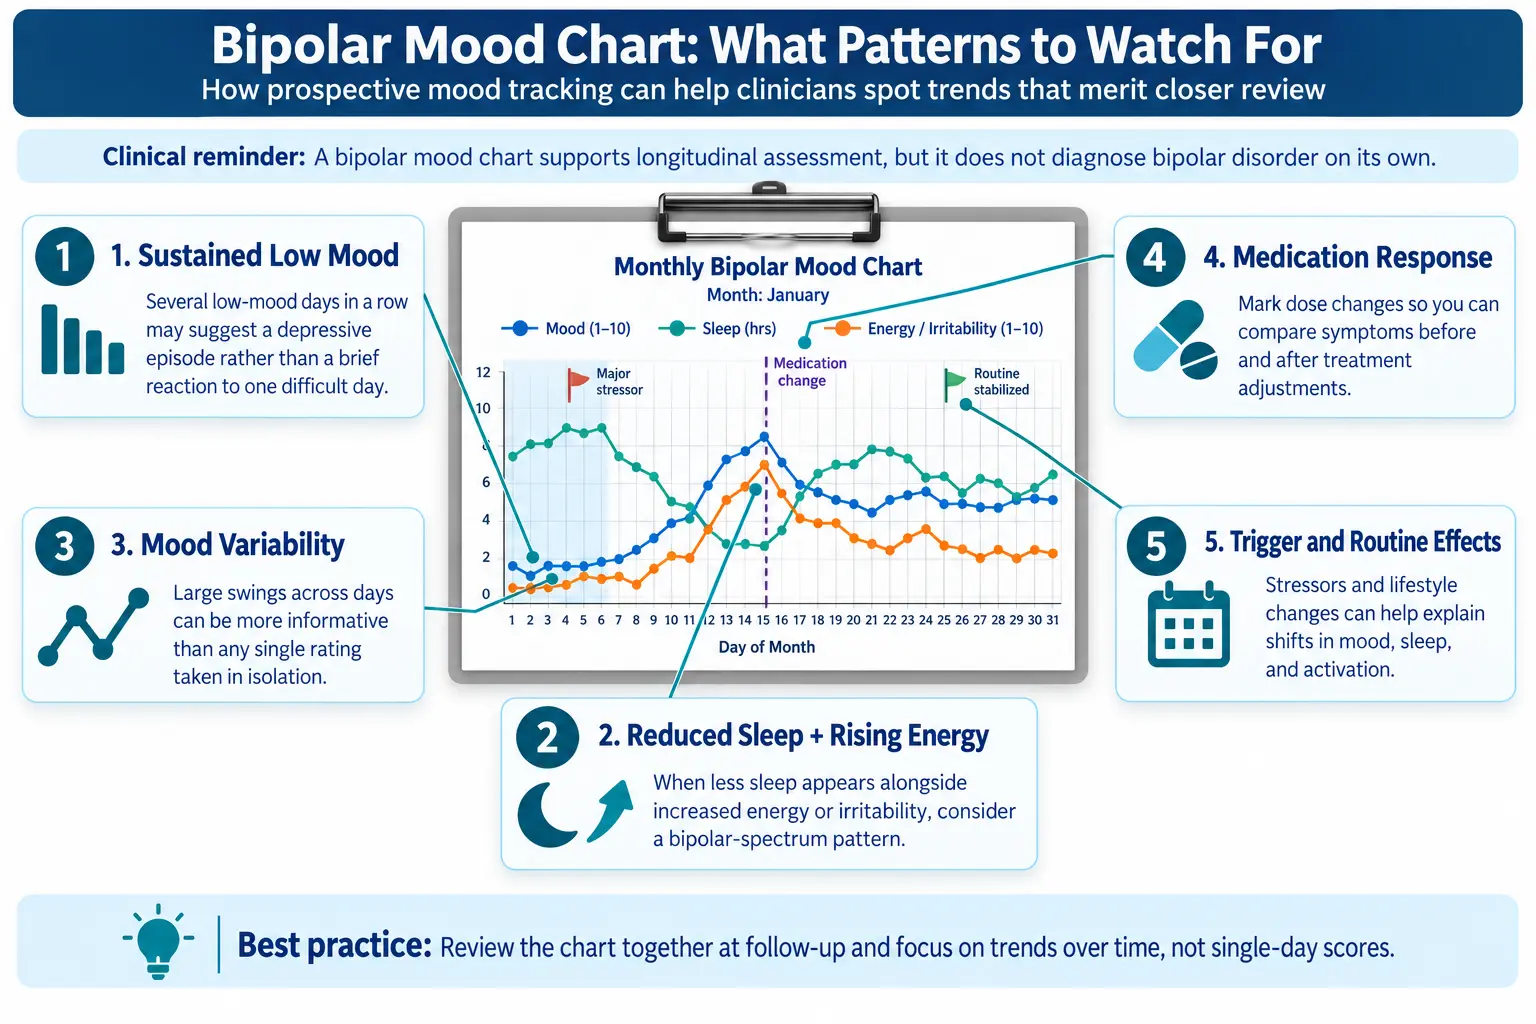
The newest and largest evidence does not support treating mood tracking as a treatment in itself. A 2026 systematic review and meta-analysis in JMIR Mental Health pooled eight randomized controlled trials involving 1,230 participants across six mood-monitoring protocols (Astill Wright et al., 2026).
The researchers found a small, non-significant effect on mania symptoms and no significant effect on bipolar depression. For unipolar depression, mood monitoring produced only a small effect that reached borderline significance at 12 months but not at six months. The review also found no evidence that mood monitoring reduced relapse or readmission rates.
The practical takeaway is that mood tracking appears suitable as an outcome-measurement tool, but the evidence does not show that tracking alone reliably improves mood symptoms.
That is not an argument against tracking. It is an argument against selling tracking to your patients as a treatment rather than what it actually is: a measurement and insight tool that supports the treatment you are already delivering. Where the evidence is more favorable is on the insight side. Patients and clinicians who use structured mood monitoring get better resolution on triggers, early warning signs, and medication response than they get from recall alone, which is why tracking shows up consistently in relapse-prevention planning for bipolar disorder even without a strong RCT signal for symptom reduction.
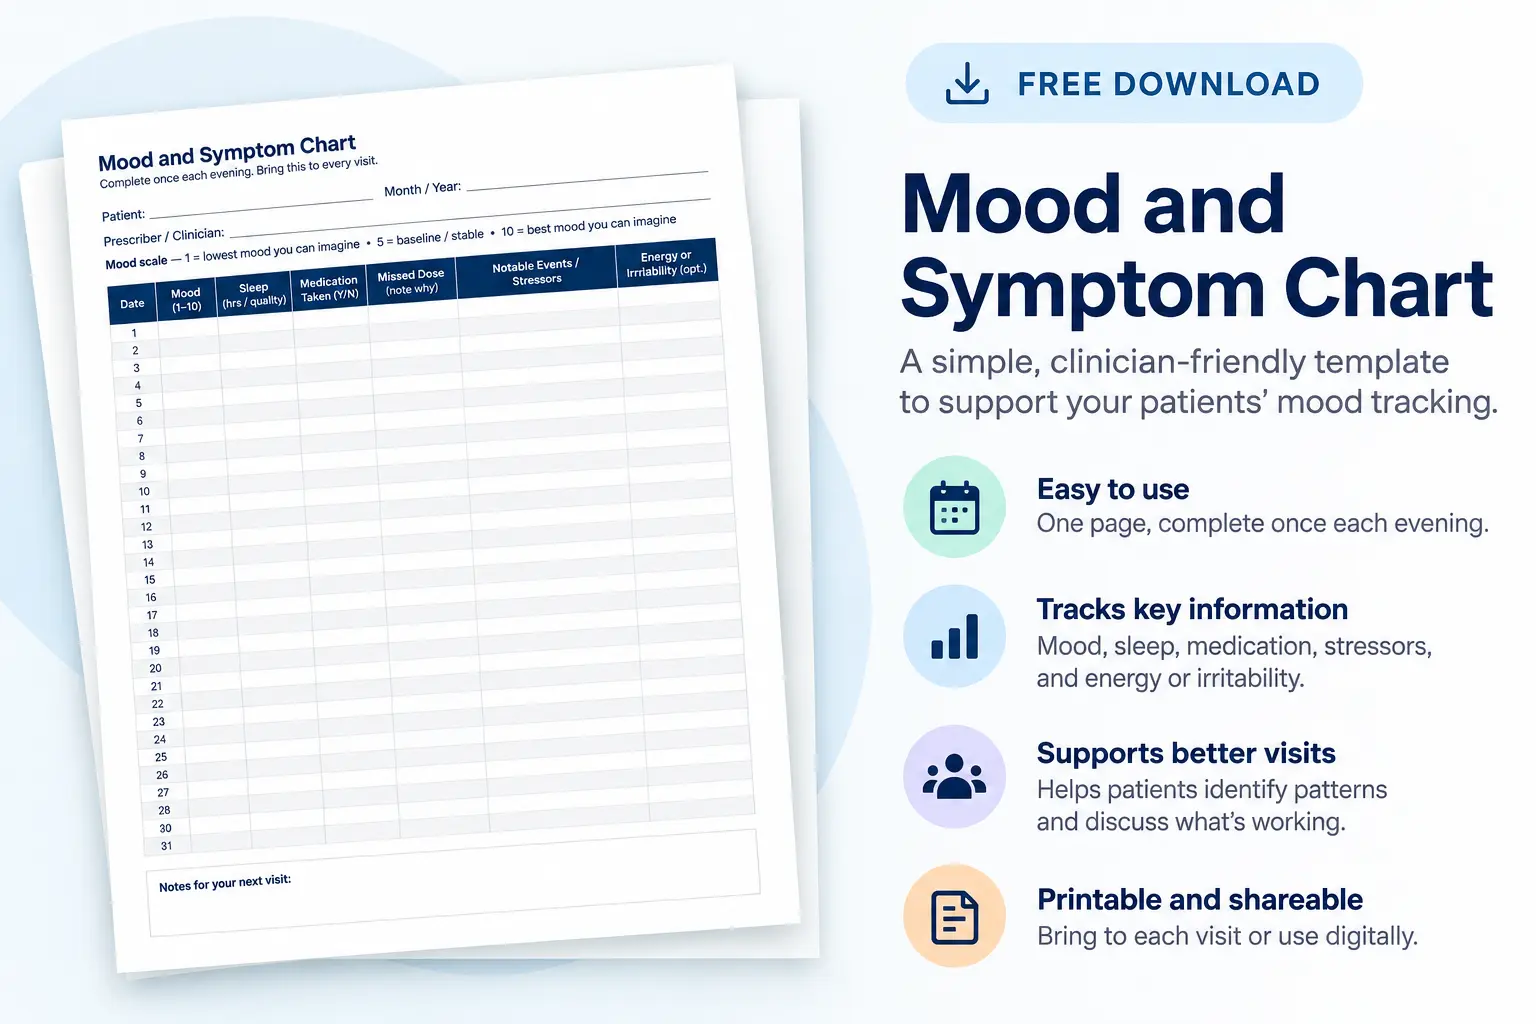
Help Patients Track the Patterns That Matter
Download the free Mood and Symptom Chart to give patients a simple, structured way to track clinically relevant changes between visits.
- Track mood, sleep, medication adherence, stressors, and energy or irritability
- Capture a full month of daily observations on one easy-to-use page
- Review patterns together at follow-up to support more informed clinical decisions
Where Mood Tracking Falls Short: The Pitfalls Clinicians Need to Know
Before you hand a patient a mood log, it helps to know exactly where the tool tends to fail so you can design around it rather than get surprised by it.
Reactivity
Self-monitoring changes the behavior being monitored. This is not a new finding. Nelson and Hayes documented reactivity in self-monitoring back in 1981, describing how tracking a target behavior, mood included, often produces a change in that behavior independent of any other intervention (Nelson & Hayes, Behavior Modification, 1981). For a patient tracking irritable outbursts or substance use, that reactivity can be a genuine clinical asset. For a patient tracking mood as a passive measurement, it means the chart itself is not a neutral record. Build that into how you interpret the data, especially in the first week or two.
Adherence drop-off
The 2026 JMIR Mental Health meta-analysis found pooled adherence across 77 mood monitoring studies sat at 64%, with attrition of 28%, over an average tracking window of 6.9 months (Astill Wright et al., 2026). Reporting itself was inconsistent. More than three-quarters of the studies did not report attrition or adherence at all, which the authors flagged as a validity problem for the field. In practice, this means you should expect meaningful drop-off after the first month and plan your review cadence around week two and week four, not week twelve.
Data overload
A daily mood log with ten fields feels thorough on paper and becomes a burden by day five. Ecological momentary assessment research, which asks patients to log mood multiple times a day, consistently shows a tradeoff between data richness and completion rates. The more granular the ask, the fewer patients keep doing it past the first week. Match the tracking burden to what the patient can sustain, not to how much you would like to know.
Validity and self-report bias
A mood rating is a subjective number filtered through the same cognitive distortions, insight limitations, and same-day mood state you are trying to measure. A patient in a depressive episode may rate every day a 3 regardless of actual variation. A patient with limited insight into hypomania, the same population the MDQ is weakest at catching, may underreport elevated periods entirely. Mood charts are a useful adjunct to your own longitudinal observation, not a replacement for it.
The Mood Disorder Questionnaire: A Validated Bridge Into Tracking
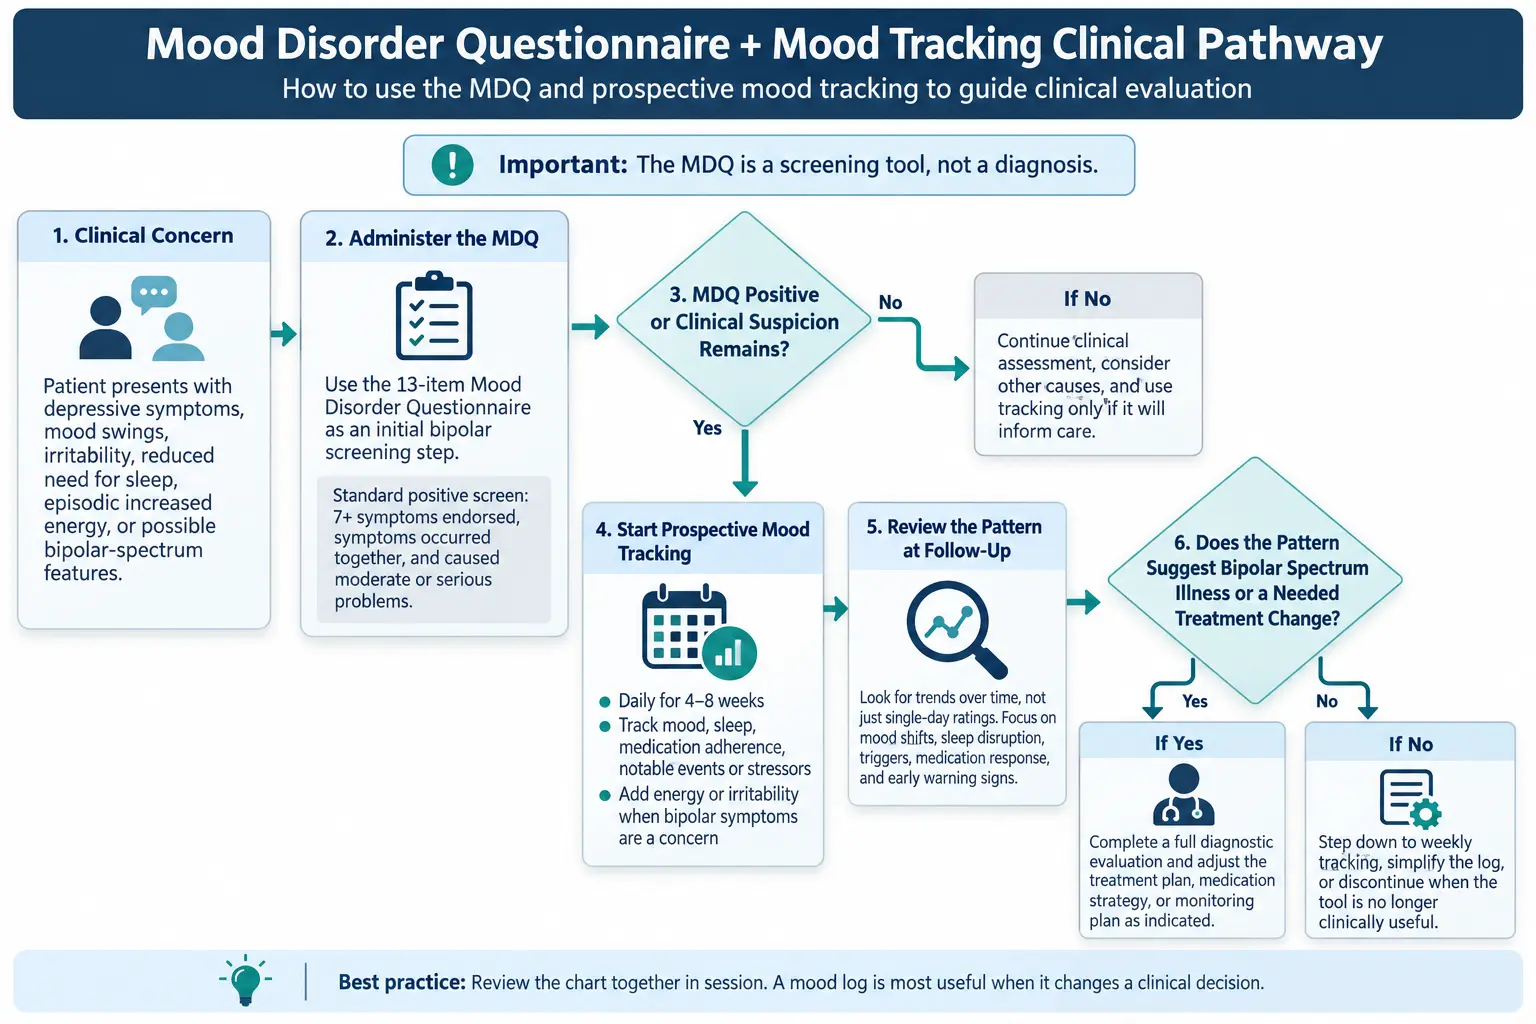
The Mood Disorder Questionnaire (MDQ) is a validated 13-item self-report screening tool for bipolar spectrum symptoms, scored positive at a cutoff of 7 or more endorsed items plus a co-occurrence and impairment criterion.
If a patient's presentation raises any question of bipolar spectrum illness, the Mood Disorder Questionnaire is the natural screening step before you start a tracking protocol, not an afterthought once it is underway. The MDQ is a brief self-report screener: 13 yes/no items covering symptoms of mania and hypomania, a follow-up item asking whether several of those symptoms occurred during the same period, and an impairment item rating how much they affected the patient's life.
The MDQ's validation history gives you a realistic picture of what it can and cannot do. An early replication study found sensitivity of 73% and specificity of 90% compared with a structured clinical interview in a psychiatric population (Miller et al., Journal of Affective Disorders, 2004).
Across multiple studies, performance is more modest. Zimmerman’s 2011 review in the Harvard Review of Psychiatry found pooled sensitivity of 61.3% and specificity of 87.5%, with a positive predictive value of 58.0% and a negative predictive value of 88.9% .
The limitation becomes especially important when screening patients who have not already been diagnosed with bipolar disorder. A 2015 meta-analysis in Depression and Anxiety found MDQ sensitivity of only 37% at the standard cutoff of 7 in patients without a prior bipolar diagnosis, compared with 76% in mixed samples that included patients with known bipolar disorder (Wang et al., 2015). In practice, that means the MDQ should inform further assessment rather than determine the diagnosis on its own.
That is exactly why it pairs so well with tracking. A positive MDQ does not diagnose bipolar disorder, and a negative one does not rule it out, particularly in a first-episode or low-insight presentation. What it does is give you a structured, validated reason to start prospective mood and symptom monitoring instead of relying on retrospective recall at the next visit, which research on bipolar course consistently shows is unreliable across more than a few weeks back. Use the MDQ score to set the frame for the patient: "your answers suggest we should look at this more closely over time," rather than "your answers say you have bipolar disorder."
Building Mood Tracking Into a Treatment Plan or Medication-Management Workflow
Tracking works best when it has a specific job inside the treatment plan, not a general "keep an eye on things" mandate. Before you introduce it, decide what question the data needs to answer.
- New diagnosis or diagnostic uncertainty. Track mood, sleep hours, and energy daily for 4 to 8 weeks to clarify episode pattern and rule mood cycling in or out.
- Medication titration. Track mood, side effects, and adherence daily through each dose change, then step down to weekly once the dose is stable.
- Relapse prevention in a stable patient. A brief weekly check-in, sometimes just three or four items, is enough to catch early warning signs without asking a well patient to over-monitor.
- Therapy process tracking. In CBT or DBT-informed work, mood tracking often pairs with a specific skill or thought record, so the log doubles as homework that reinforces the modality itself.
Cadence matters as much as content. Daily tracking gives you the resolution needed for titration and diagnostic clarification, but it is also where the 64% adherence ceiling from the 2026 meta-analysis bites hardest. Weekly tracking sustains better long term for maintenance-phase patients. A practical middle path many practices use: daily for the first 4 weeks, then a joint decision at the follow-up visit about whether to continue daily, step down to weekly, or stop.
Whatever cadence you choose, the log only earns its place in the treatment plan if you actually look at it. A mood chart that gets collected and filed without discussion teaches the patient that the exercise did not matter, which is a fast route to the adherence drop-off described above.
A Prescription-Style Protocol You Can Implement This Week
Prescribers already think in terms of indication, dose, and duration. The protocol below borrows that structure on purpose, because a mood tracking plan that is this specific is easier to follow than "try tracking your mood for a while."
Rx: Mood and Symptom Tracking
New mood disorder diagnosis, suspected bipolar spectrum presentation, medication titration, or relapse-prevention monitoring in a previously stable patient.
Complete once daily at a consistent time (evening works well for most patients). Rate overall mood 1 to 10, log hours slept, note medication doses taken, and flag any notable event or stressor.
Minimum 4 weeks before the first formal review.
Continue with review at every follow-up visit. Step down to weekly logging once mood and dose are stable, or discontinue if the patient is not completing entries by week 3.
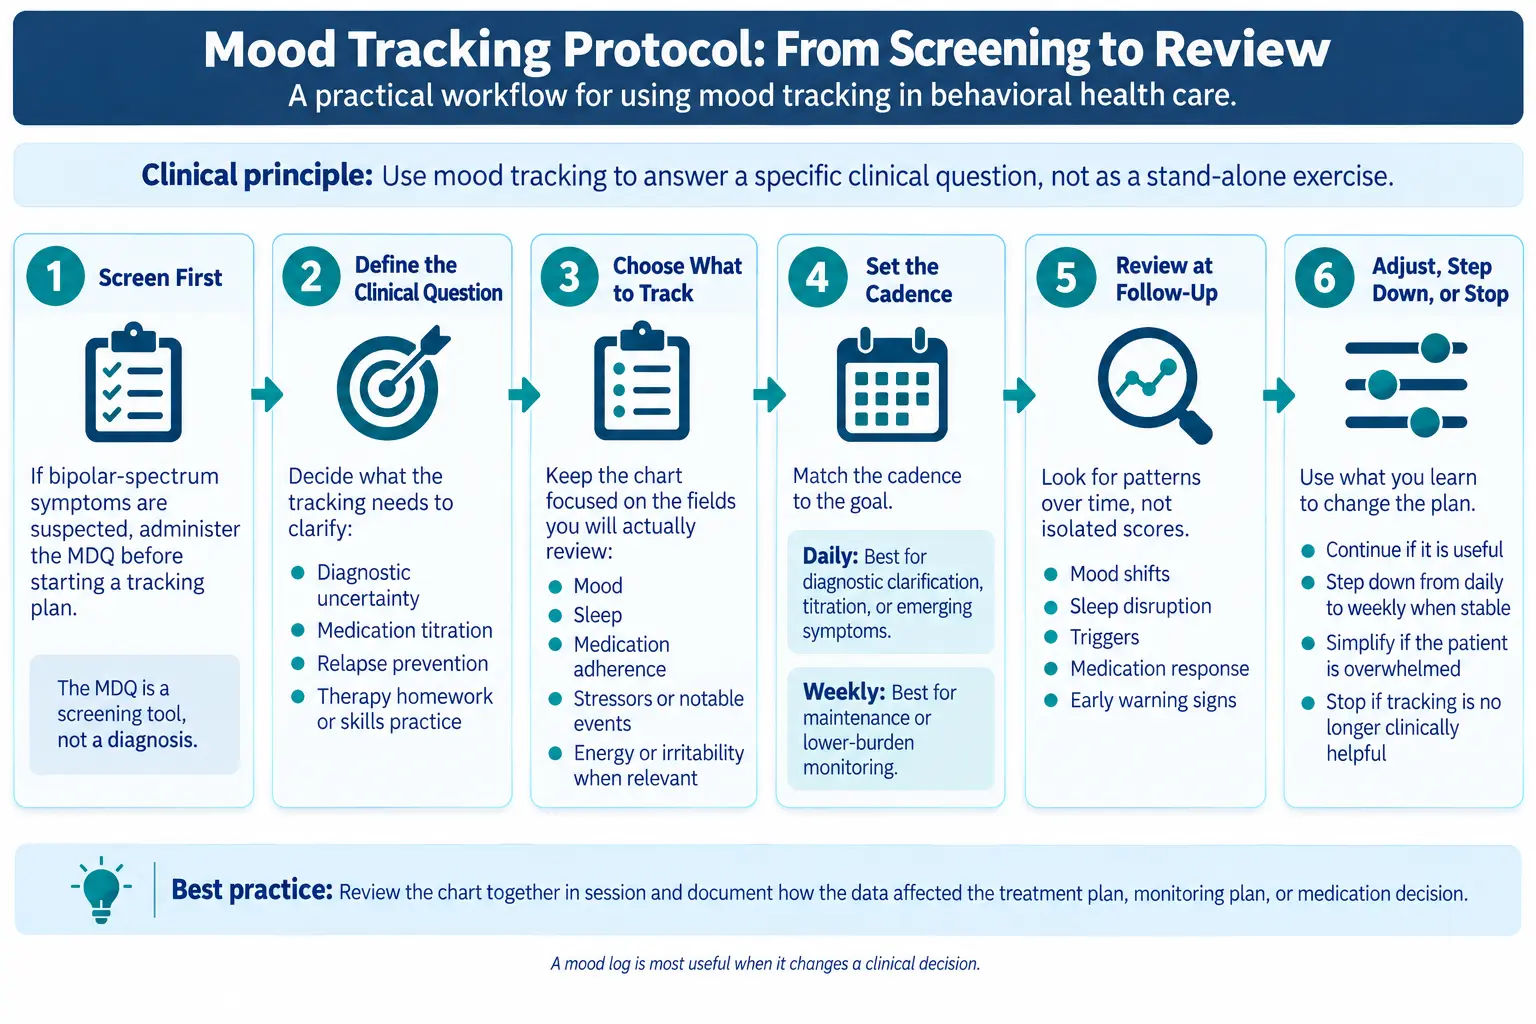
- Screen first. If bipolar spectrum illness is on the differential, administer the MDQ before you introduce tracking. The result shapes what you are watching for.
- Introduce it in session, not by handout alone. Explain the specific question the chart is meant to answer for this patient. A generic "track your mood" instruction handed over at checkout gets a generic, short-lived response.
- Pick the format together. Some patients want a printed daily mood log, some want a mood tracking app on their phone, and some do better with a simple weekly mood diary. The best format is the one they will actually complete.
- Set the cadence and the ceiling. Tell the patient exactly how often to log and how many fields to fill in. Three to five fields beats ten for anyone who has never tracked before.
- Review it at the top of the next visit. Look at the chart before you ask "how have you been." Let the data set the agenda rather than confirm or contradict what the patient just told you verbally.
- Adjust or graduate the protocol. Increase frequency during a titration, decrease it once stable, and say so explicitly. Patients stick with tracking longer when they can see it responding to their progress.
- Know when to stop. If a stable, long-term patient is tracking out of habit rather than need, or if tracking is feeding rumination rather than insight, particularly in patients with depression or anxiety, retire the log and say why.
Patient Scripts for Introducing and Following Up on Mood Tracking
These are written to be read close to verbatim or adapted to your own phrasing. The first two introduce tracking, the second two follow up on it, one for a therapy context and one for medication management.
Script 1: Introducing tracking in a therapy session
“I'd like us to start tracking your mood between now and our next session. Nothing complicated, just a number from 1 to 10 each evening, plus a line for what was going on that day. The reason I'm asking is that when we talk in session, we're really only working from what you remember about the last week, and memory tends to flatten things out or get pulled toward however you're feeling right now. A daily log gives us the actual pattern. We'll look at it together at the start of each session, and if the format isn't working for you after a couple of weeks, we'll change it.”
Script 2: Following up in therapy
“Let's start by looking at your log before we get into how the week went. I see your mood dipped on Tuesday and Wednesday. What was happening around then? [pause for response] That matches something you mentioned a few weeks ago about deadlines at work. I want to flag that pattern because it's shown up twice now, which tells me it's worth building a specific plan around rather than treating it as a one-off.”
Script 3: Introducing tracking in a medication-management visit
“Based on what you've described, and your answers on the screening questionnaire we just went through, I want to get a clearer picture of your mood pattern before we make any changes to your medication. I'm going to have you track your mood, sleep, and whether you took your medication each day for the next month. This isn't a test, and there's no wrong answer to write down. It's the same kind of tool I'd use to adjust a blood pressure medication based on daily readings rather than guessing. We'll go over it together at your next visit, and it'll directly shape whether we adjust your dose.”
Script 4: Following up in medication management
“Your log shows your mood's been more stable the last two weeks compared to when we started, averaging around a 6 instead of the 3s and 4s we saw initially. Sleep has also evened out to about seven hours most nights. Based on that trend, I think the current dose is working, and I'd like to hold steady for another month rather than adjust anything yet. Keep logging daily through the next visit so we can confirm this is a real trend and not a short stretch of good days.”
Mood Tracker Apps vs. a Clinician-Provided Mood Tracking Chart
Patients may ask whether they should download a mood tracker app instead of completing the mood tracking chart or sheet you provide. The better choice depends less on paper versus digital format and more on what you need the data to do.
| Consumer mood tracker app (e.g., Daylio, eMoods, DBSA's Wellness Tracker) | Clinician-provided chart or log | |
|---|---|---|
| Evidence base | Mixed. A 2025 systematic review of evidence-based mental health apps found generally positive but highly variable outcomes across 38 studies (Shahsavar & Choudhury, PLoS One, 2025), while a 2025 Lancet Digital Health meta-analysis called standalone app efficacy evidence inconclusive. | Built around the same fields you review in session, not validated as a standalone intervention, but directly tied to your treatment plan. |
| Best for | Patients who already track other habits digitally, want reminders, or want mood trend graphs on their own time. | Patients starting a new diagnostic workup, a medication titration, or anyone you want to see using the exact fields relevant to their case. |
| Data you actually get | Varies widely by app. Some export clean CSVs, many do not integrate with anything you can bring into the chart. | Whatever you design it to capture, reviewable on paper or transcribed directly into the note. |
| Watch for | Apps built for general wellness rather than clinical use may not track what you need (medication timing, specific symptom clusters) and can add screen time for patients who are trying to reduce it. | Lower engagement for tech-comfortable patients who find paper tedious. |
A reasonable default: recommend an app to patients who are already comfortable with the format and unlikely to lose a phone-based habit, and hand a printed or PDF chart to patients starting a structured protocol where you need specific fields tracked consistently from day one.
Your Downloadable Mood and Symptom Chart: What Belongs on It
The downloadable chart referenced throughout this guide is a one-page monthly mood tracker built around the fields that actually inform clinical decisions, rather than a generic wellness tracker. It gives patients one place to record mood, sleep, medication adherence, stressors, and optional energy or irritability across an entire month. At minimum, a clinically useful mood tracking chart should include:
- A daily mood rating, 1 to 10, with brief anchor descriptions at 1, 5, and 10 so ratings stay consistent week to week
- Hours slept and a subjective sleep quality rating
- Medication doses taken, with space to note missed doses
- A short field for notable events, stressors, or triggers
- An optional energy or irritability rating for patients on the bipolar spectrum, since mood alone can miss early hypomanic signs
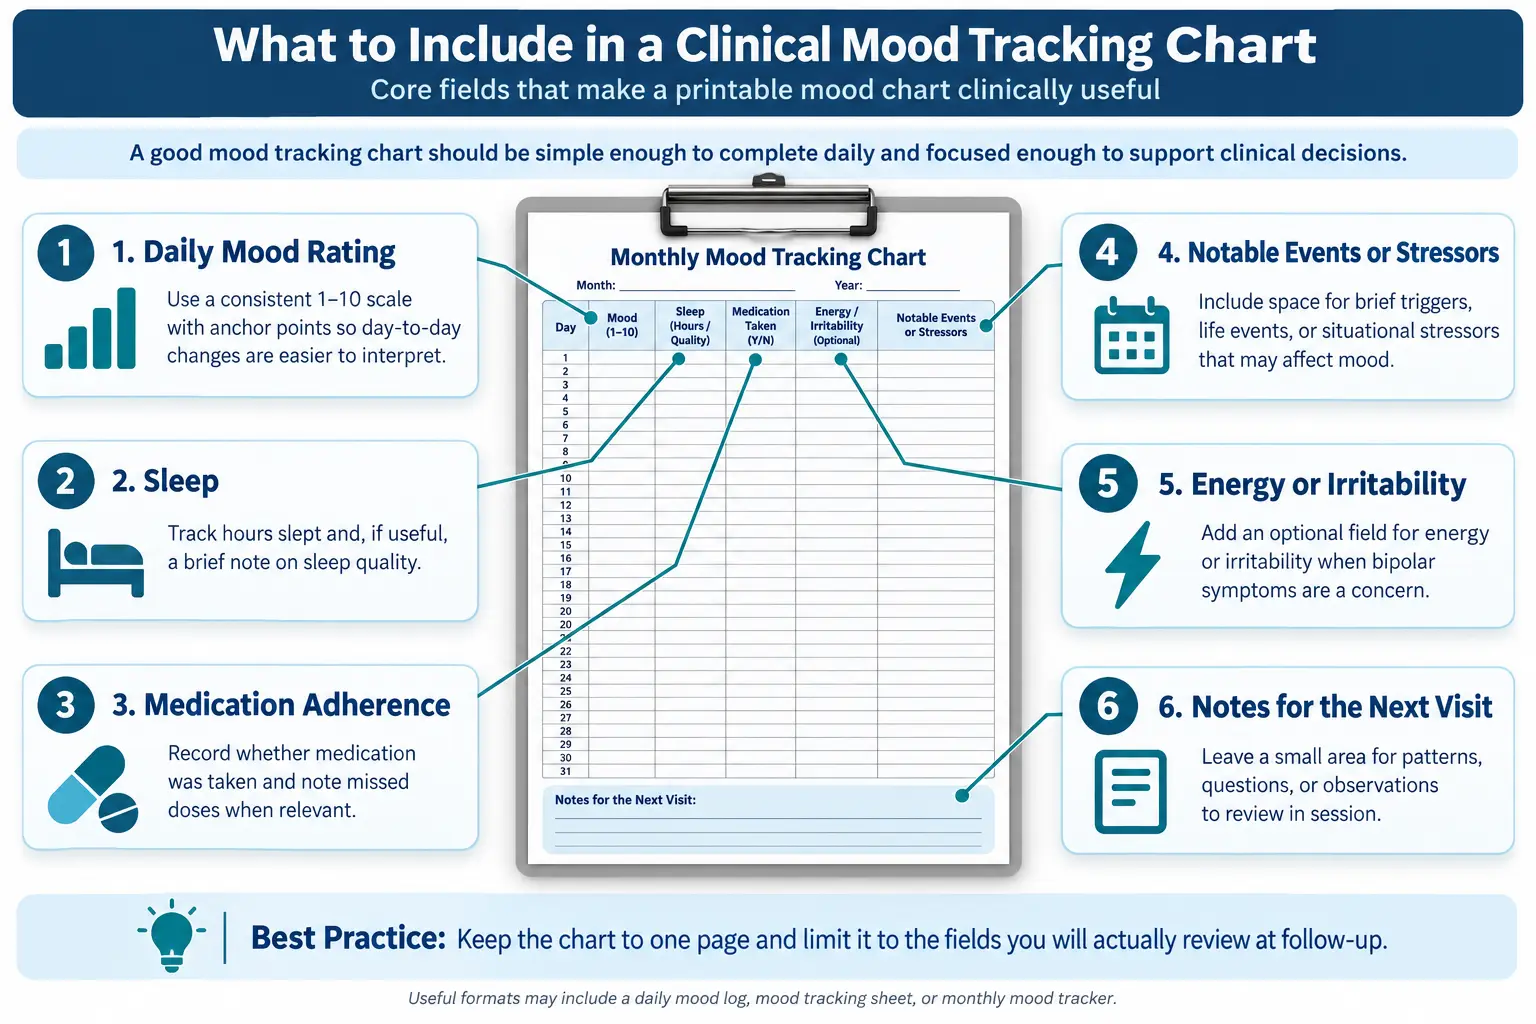
Keep it to one page. A mood tracking worksheet that spans multiple pages or asks for more than five or six data points per day is the fastest way to end up back in that kitchen drawer. This same one-page structure works whether you're using it as a bipolar mood chart, a general mood chart for adults in outpatient therapy, or a simpler daily mood log for a patient who needs a baseline before the next visit. Because the printable mood tracking sheet covers a full month, patients can bring one completed page to a follow-up visit rather than managing multiple weekly worksheets.
The free mood tracking PDF follows this streamlined format and can be printed for patients completing a four-week monitoring protocol.
Download the Mood and Symptom Chart (Mood Tracking PDF Template)
Where ICANotes Fits
Everything above works on paper. It works better when the chart data has somewhere to go that does not add another five minutes to your documentation. ICANotes lets you document mood, sleep, and symptom trends in the same clinical record where you're already documenting the visit. Clinicians can also use more than 100 built-in behavioral health rating scales to support measurement-based care, giving you both day-to-day patient-reported observations and standardized symptom measures in one workflow. When a patient hands you a filled-out mood log, or you're reviewing app-exported data during a med-management visit, that information can go straight into a structured progress note rather than a scanned attachment nobody reopens.
For prescribers, tracking becomes especially valuable when the data changes a clinical decision, such as a dose adjustment, diagnostic clarification, or relapse-prevention plan. ICANotes' integrated e-prescribing workflow includes EPCS and PDMP functionality within the same patient record, so the clinical reasoning documented from mood and symptom trends can remain connected to the resulting medication decision. If you are documenting a bipolar diagnostic workup or a titration and want your mood-tracking protocol reflected in a note that supports medical necessity on its own, that structure is worth seeing directly.
Turn mood-tracking data into decision-ready documentation
See how ICANotes lets you capture mood, sleep, and symptom trends in the same record where you write the note. Start your free trial and document measurement-based care without adding to your charting time.
- 100+ built-in behavioral health rating scales
- Log mood and sleep trends straight into the note
- Integrated e-prescribing with EPCS and PDMP
- Notes that support medical necessity
See how ICANotes can support your clinical workflow. Start your free 30-day trial, no credit card required.
Start Your Free 30-Day Trial
Frequently Asked Questions
Is a mood chart the same thing as a mood log?
Is a monthly mood tracker better than a weekly mood log?
Does the Mood Disorder Questionnaire diagnose bipolar disorder?
How often should a patient complete a daily mood log?
Are mood tracking apps as good as a paper chart or PDF?
Can mood tracking replace standardized rating scales like the PHQ-9 or GAD-7?
What should I do if a patient stops filling out their mood log?
References
- Astill Wright, L., et al. (2026). Adherence and attrition in mood monitoring and ambulatory assessment: a systematic review and meta-analysis. JMIR Mental Health. Pooled 77 studies and 17,123 participants, reporting average adherence of 64% and attrition of 28% over a typical 6.9-month tracking period.
- Astill Wright, L., et al. (2026). Effects of mood monitoring on symptom outcomes in bipolar and unipolar mood disorders: a meta-analysis of randomized controlled trials.* JMIR Mental Health. *Pooled 8 RCTs and 1,230 participants across 6 mood monitoring protocols, finding no significant effect on bipolar mania or depression and a small, borderline-significant effect on unipolar depression at 12 months.
- Zimmerman, M. (2011). Would the Mood Disorders Questionnaire be a better screening instrument if some items were eliminated? Harvard Review of Psychiatry. Pooled validation data across multiple studies, reporting MDQ sensitivity of 61.3%, specificity of 87.5%, positive predictive value of 58.0%, and negative predictive value of 88.9%.
- Wang, H.-R., et al. (2015). Diagnostic accuracy of the Mood Disorder Questionnaire in patients with and without a prior bipolar diagnosis.* Depression and Anxiety. *Meta-analysis finding MDQ sensitivity at the standard cutoff of 7 drops to 37% in patients without a prior bipolar diagnosis, compared to 76% in mixed samples that include known bipolar patients.
- Miller, C. J., et al. (2004). Sensitivity and specificity of the Mood Disorder Questionnaire for detecting bipolar disorder. Journal of Affective Disorders. Replication study against a structured clinical interview, reporting sensitivity of 0.73 and specificity of 0.90 in a psychiatric population.
- Nelson, R. O., & Hayes, S. C. (1981). Theoretical explanations for reactivity in self-monitoring. Behavior Modification. Foundational analysis documenting that self-monitoring a behavior or mood state tends to change it, independent of any other intervention.
- Journal of Affective Disorders (review). Description of the NIMH Life Chart Method as an important clinical tool for monitoring the bipolar mood course, supporting both clinician and patient understanding of how mood, sleep, and life events interact over months rather than single visits.
- Lewis, C. C., et al. (2018). Implementing measurement-based care in behavioral health: a review. Psychiatric Services. Describes measurement-based care as the systematic evaluation of symptoms before or during a visit to inform treatment decisions.
- Shahsavar, Y., & Choudhury, A. (2025). Evidence-based mental health apps: a systematic review. PLoS One. Reviewed 38 studies of CBT-based mental health apps, finding generally positive but highly variable outcomes.
- Lancet Digital Health (2025). Meta-analysis of standalone smartphone mental health app efficacy, characterizing the evidence base for standalone apps as inconclusive.
Dr. October Boyles
Dr. October Boyles is a behavioral health expert and clinical leader with extensive expertise in nursing, compliance, and healthcare operations. With a Doctor of Nursing Practice (DNP) and advanced degrees in nursing, she specializes in evidence-based practices, EHR optimization, and improving outcomes in behavioral health settings. Dr. Boyles is passionate about empowering clinicians with the tools and strategies needed to deliver high-quality, patient-centered care.